MANTA tutorial
MANTA (Microbiota And pheNotype correlaTion Analysis platform) is a software program, and MANTA can create an integrative database and analysis platform that relates microbiome and phenotypic data. It is a web application which works on most of the modern web browsers.
Though there are some difference between MANTA and MANTA basic, the main functions are more or less the same. The screen shots in this tutorial are based on MANTA.
Start an analysis
All analysis are started from selecting the samples.
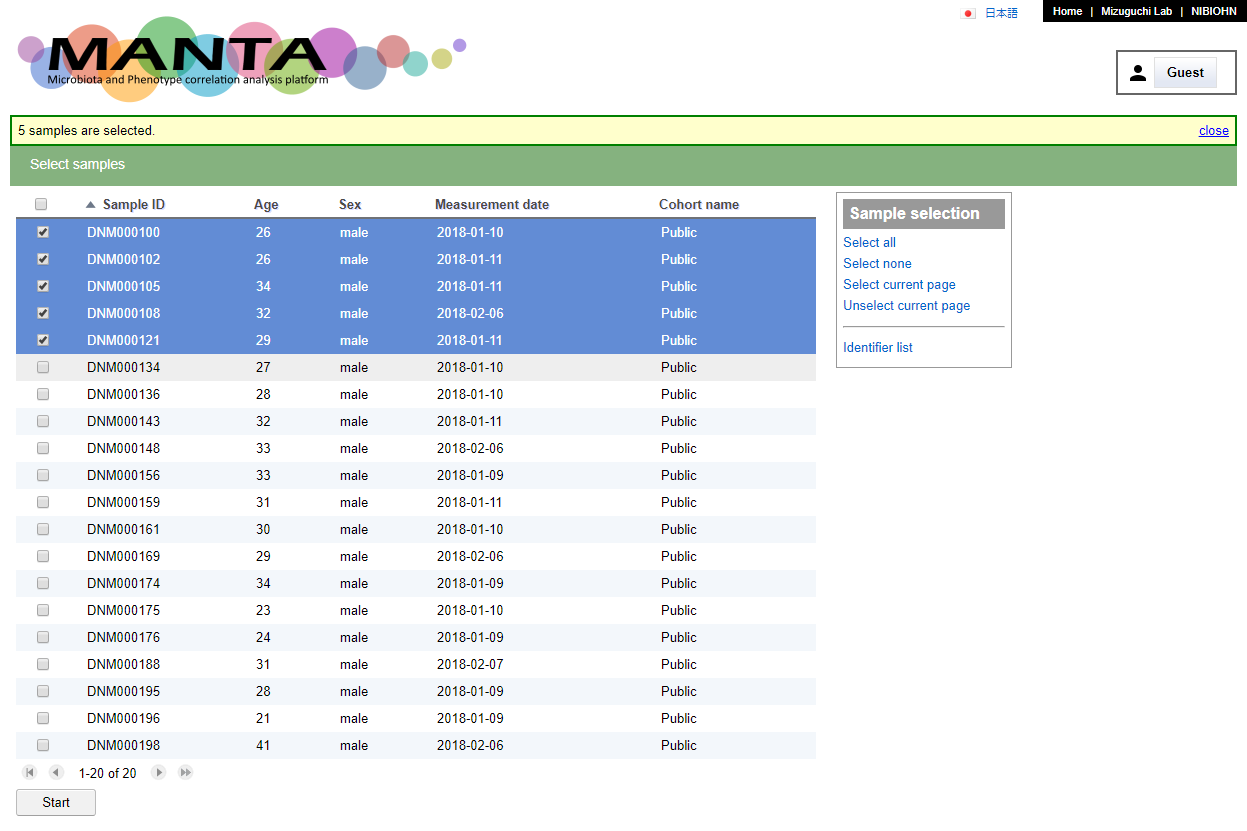
Click on the checkbox besdie the sample identifier to select the sample or click the checkbox at upper left to select all samples. There are also some options in the 'Sample selection' panel at upper right which provide some alternative way to select/unselect the samples.
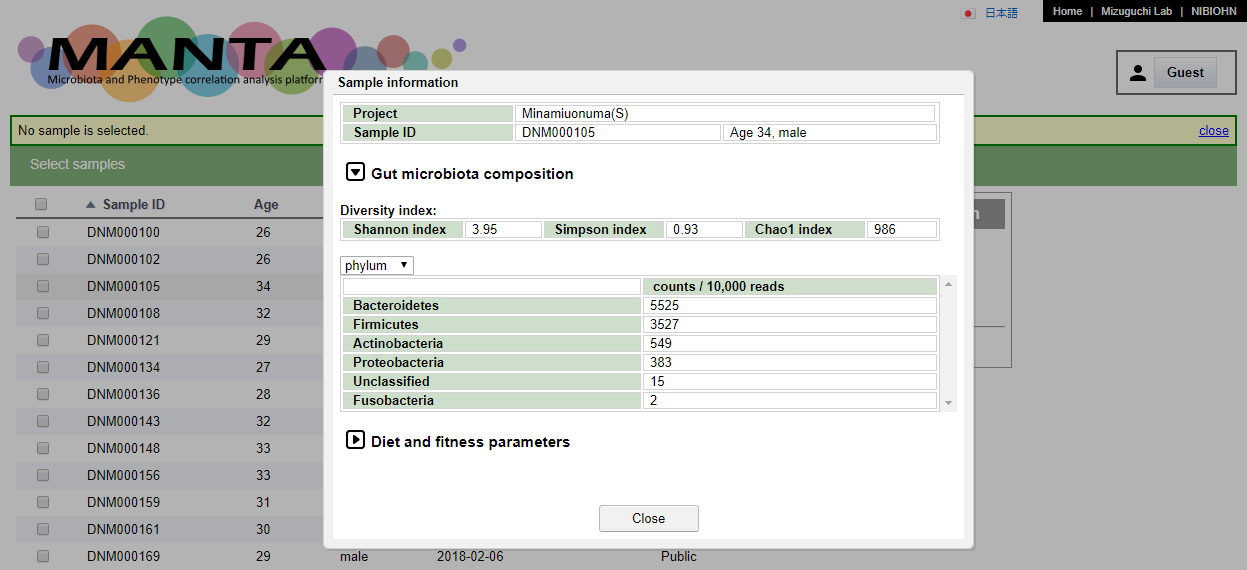
Click on the sapmle will show the data of the chosen sample.
After selecting the samples, clicking on the 'Start' button below the table will bring you to the 'Analysis' view. This view consist of a few different tabs.
Microbiota composition
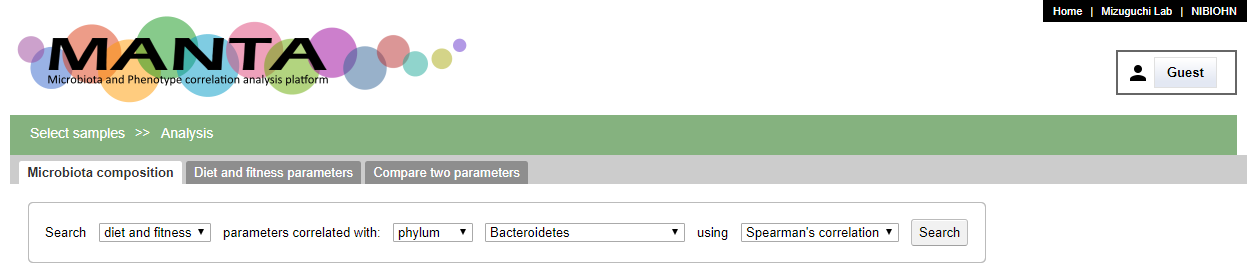
The first tab in the 'Ananlysis' view is 'Microbiota composition'
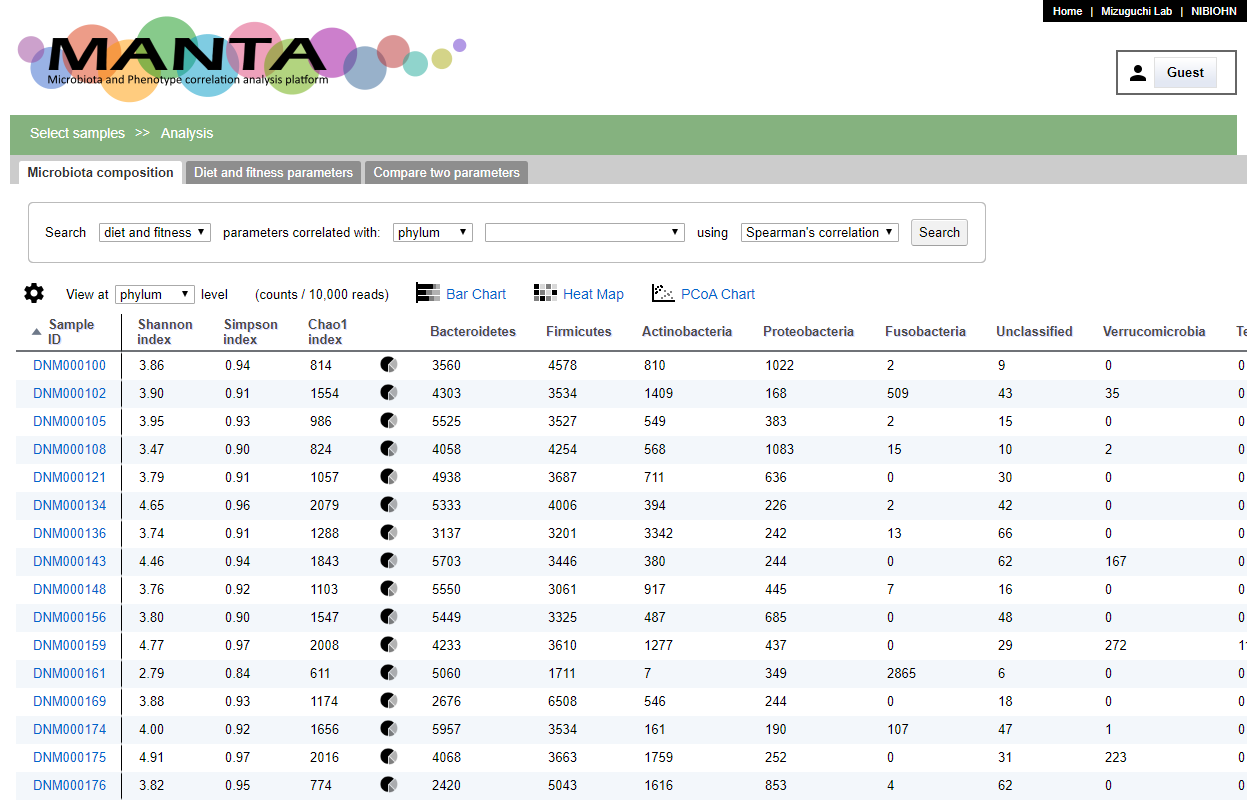
The screen could be mainly divided to 2 parts. The upper part is a panel for searching correlated phenotypic parameters against the selected taxon. The bottom part is a table of the count for each microorganism for the selected sample. The taxonomy could be viewed at different rank by using the drop-down menu at the upper left of the table.
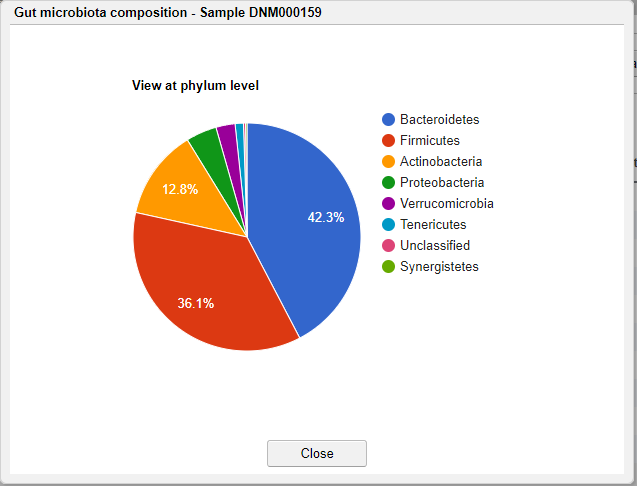
Clicking on the pie chart icon in the table will show the microbiota composition of the selected sample in pie chart. The initail rank is the same as the current viewing table. Clicking the taxon in the chart will show the composition of this taxon at the next rank level.
Visualization
You can visualize the microbiota composition in 2 ways, the 'Bar Chart' and the 'Heat Map'.
Bar Chart
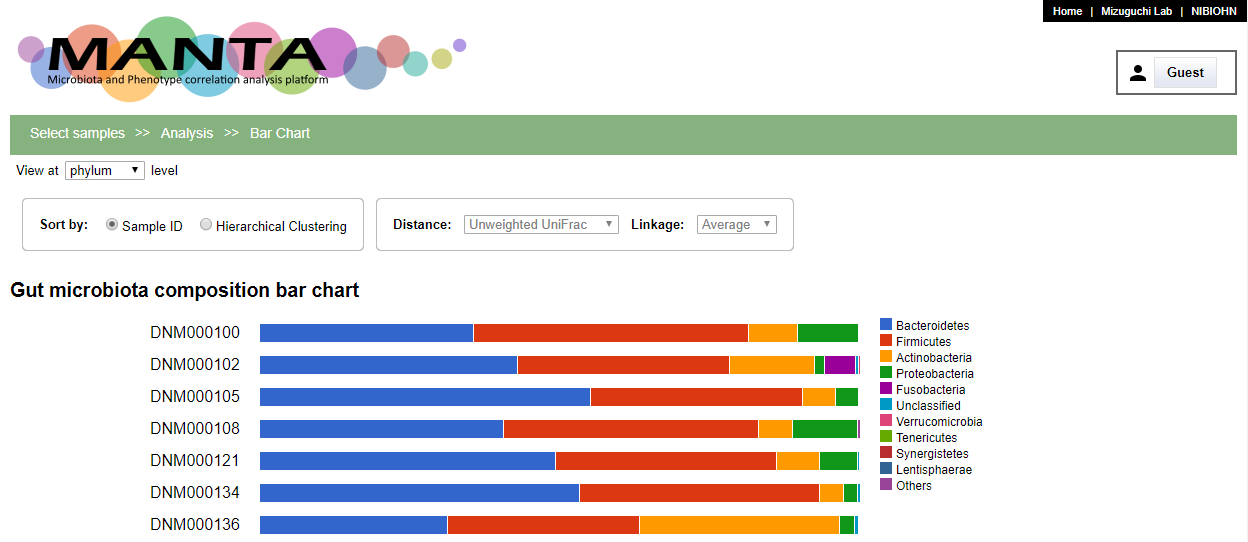
By default, the bar chart is ordered by sample identifiers. The panels at the upper part allow the samples to be shown by hierachical clustering order. A dendrogram of the clustering appears at the left side of the chart.
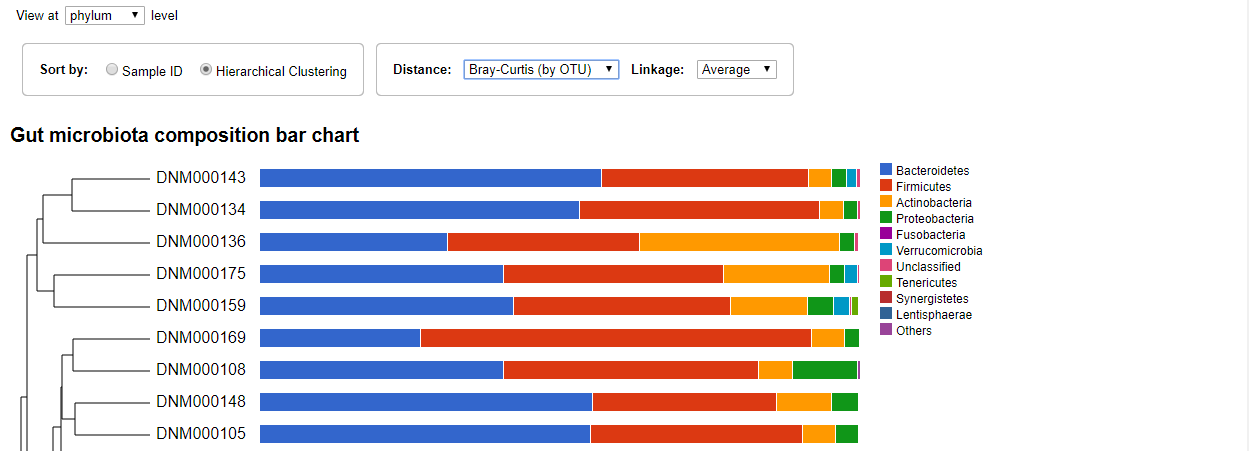
You can change the distance type and linkage type using the drop-down menus. Clicking the taxon in the chart will expand the bare and show the composition of this taxon at the next rank level.
Heat Map
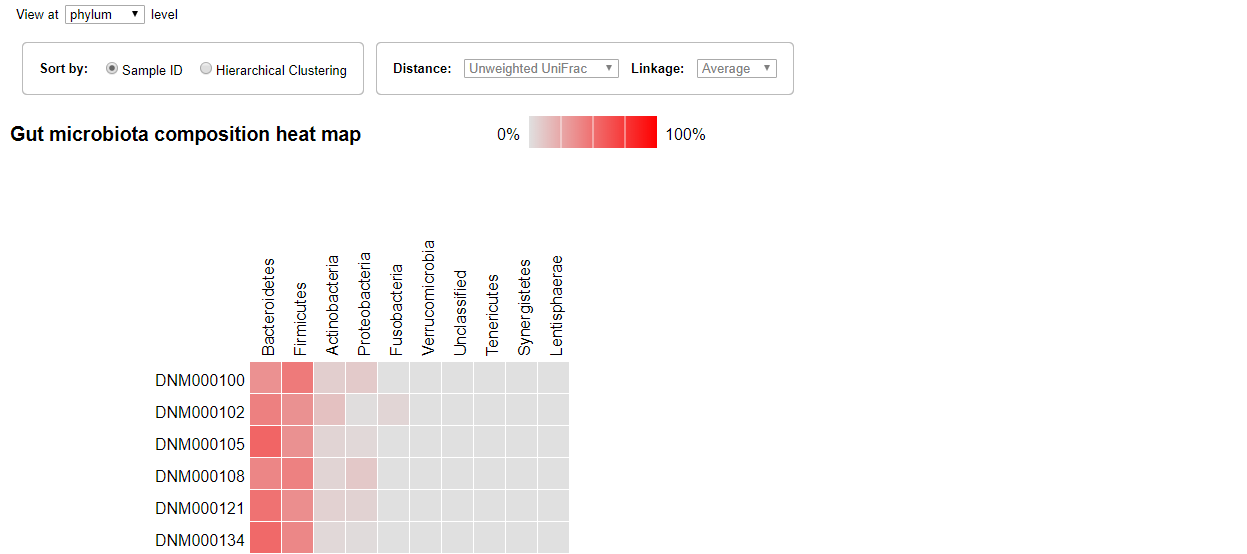
The Heat map visualization is also ordered by sample identifiers by default. The gradient of the color represent the proportion of the microorganism. The gray color is 0 while the bright red color means 100 percent.
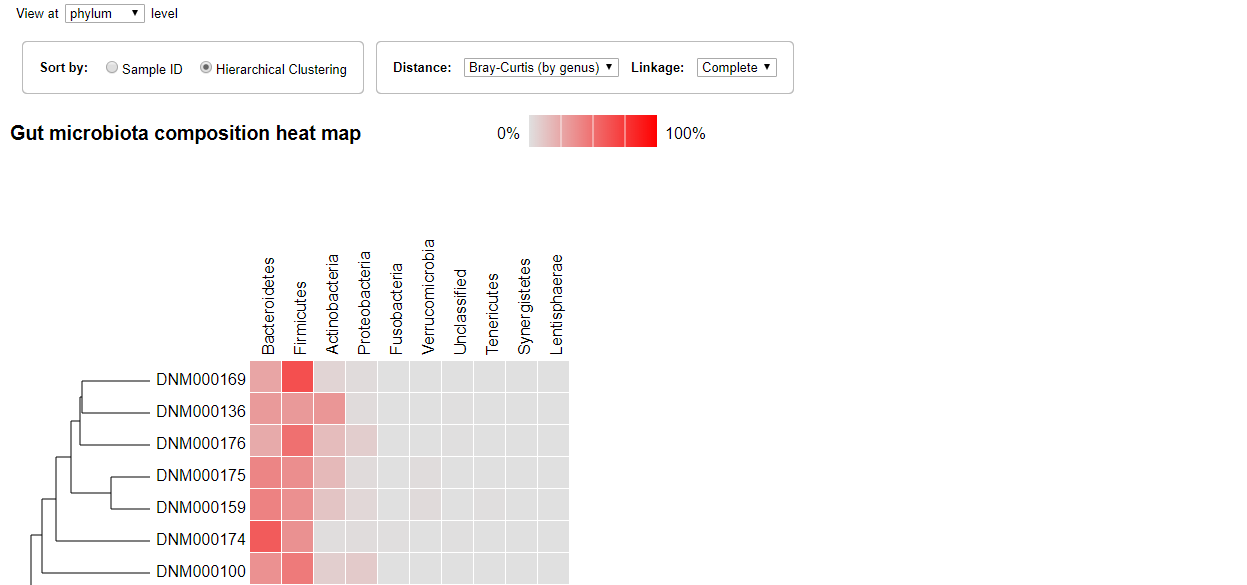
Similarly, the sample could be ordered by clustering and you can select the distance type and linkage type from the drop-down menus.
PCoA Chart
PCoA, also known as classical multidimensional scaling, is an analytical approach that visualizes distance matrix information in the form of a two-dimensional scatter plot.
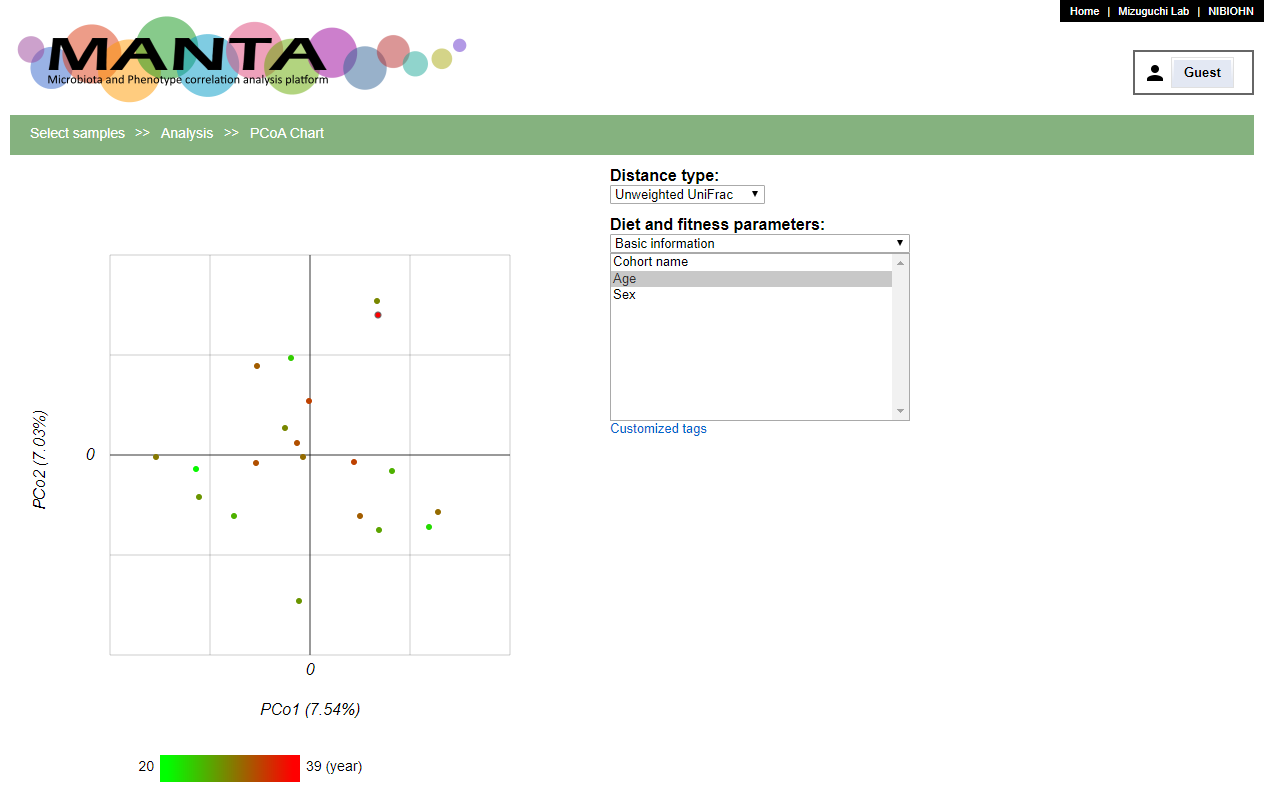
You can color the points in the polt by the parameters. The continuous numeric type parameters, e.g. 'Age', will be colored using the gradient while the catogory type ones, e.g. 'Sex', will be colored using different colors.
Search for correlated paramaters
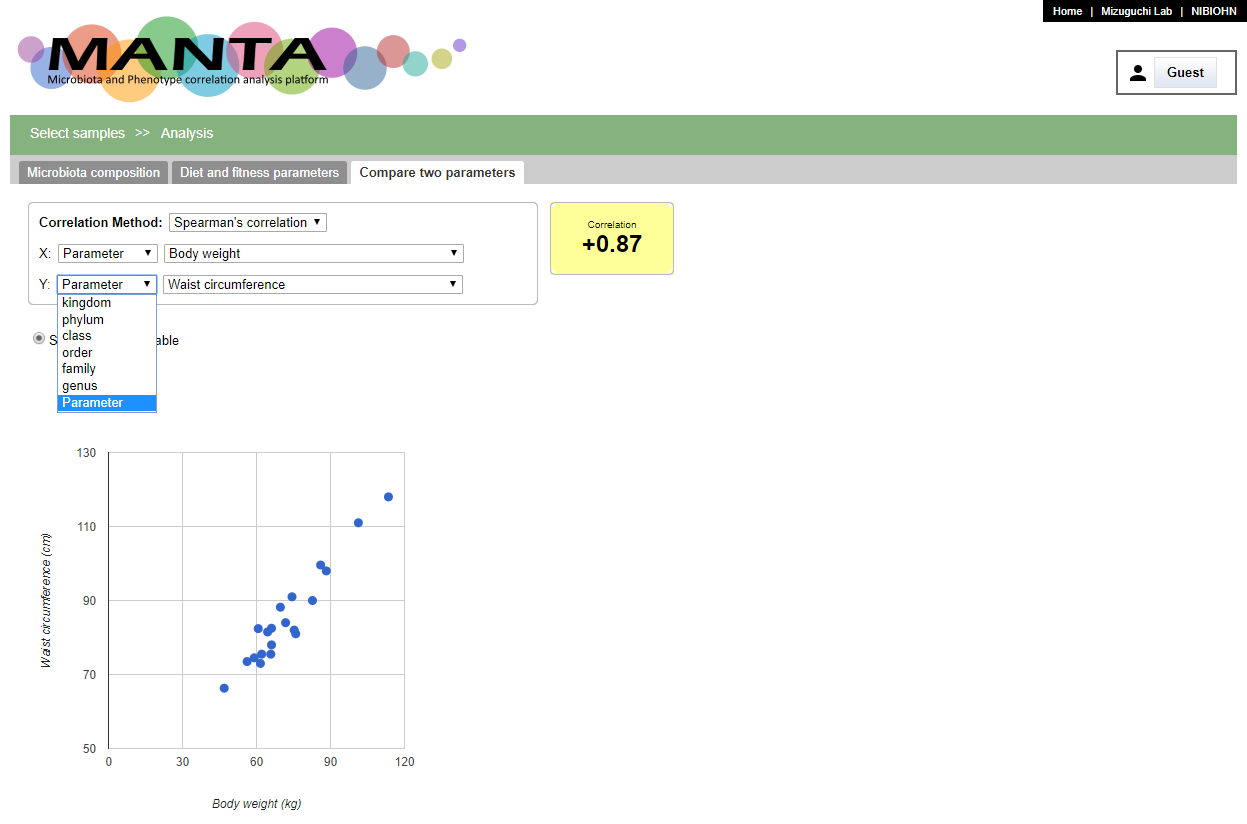
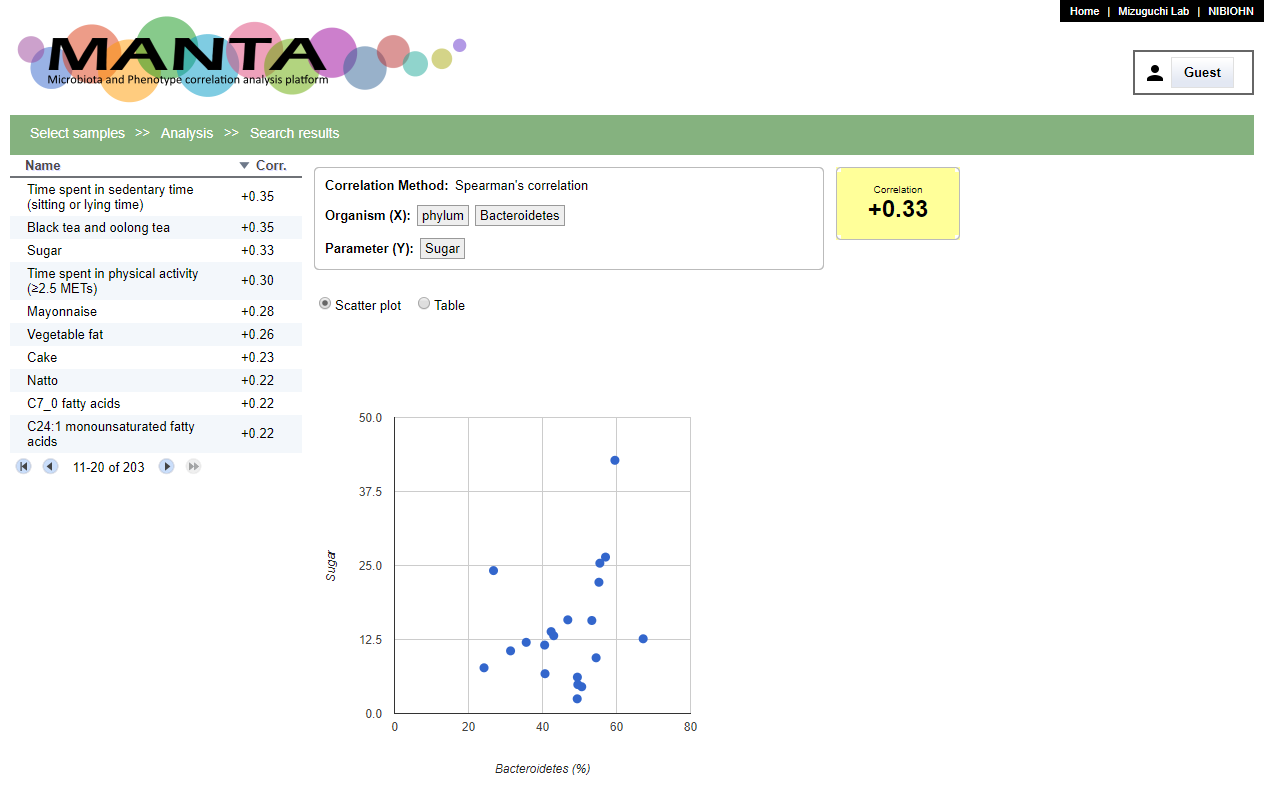
The panel at the upper part allows you to search for correlated paramaters aganist the selected taxon. The correlation could be either 'Spearman's correlation' or 'Pearson's correlation'.
The search results will be shown in a table at left side with descending order by default. You can toogle the order by clicking on the header. There is a scatter polt at the middle of the window. Clicking on the parameter will display the corresponding data in the plot.
Phenotype parameters
The second tab is 'Phenotype parameters (or Diet and fitness parameters)'. Here, you can browse the parameters in a table.
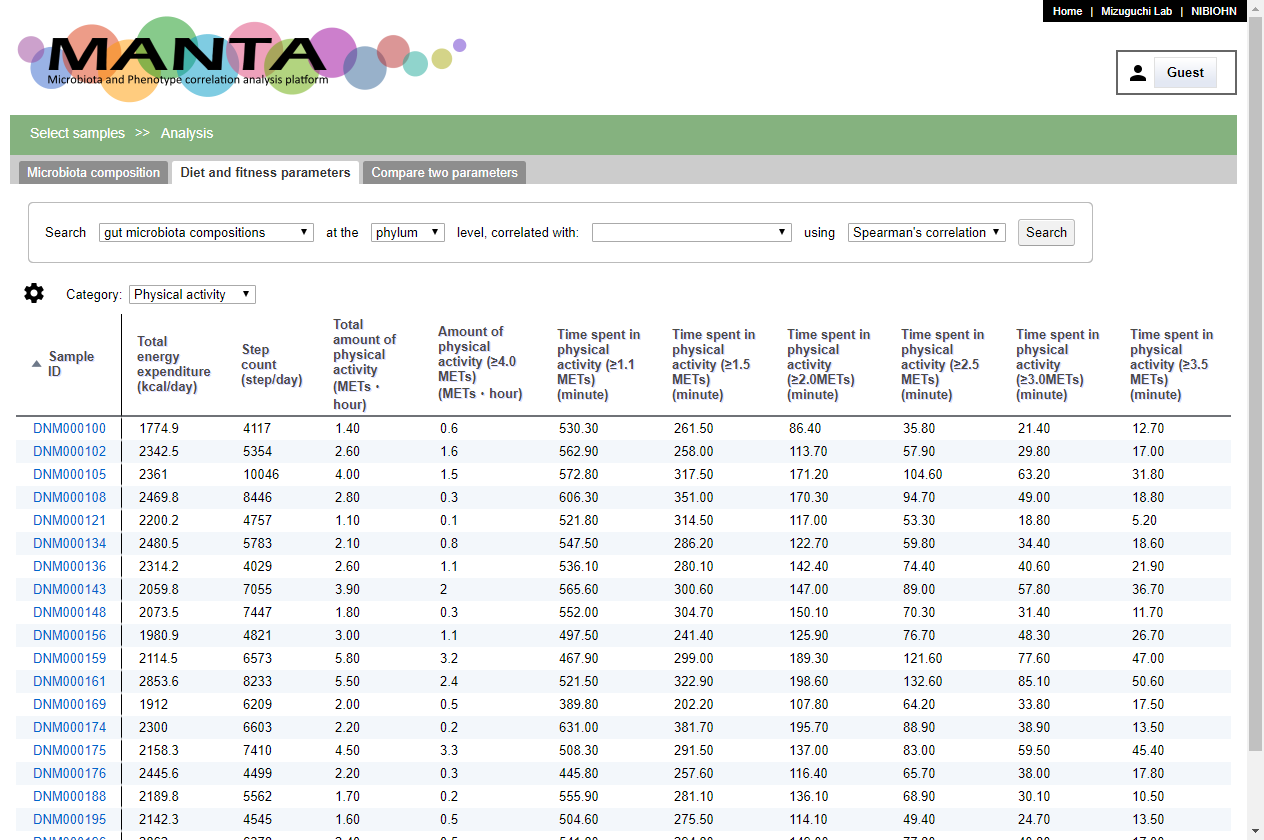
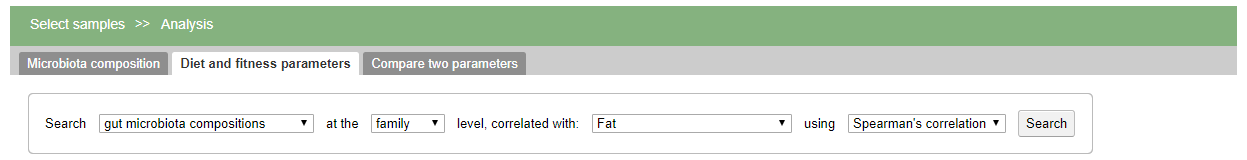
The panel at the upper part allows you to search for correlated taxa aganist the selected parameter. Similar to 'Microbiota composition', the correlation could be either 'Spearman's correlation' or 'Pearson's correlation'.
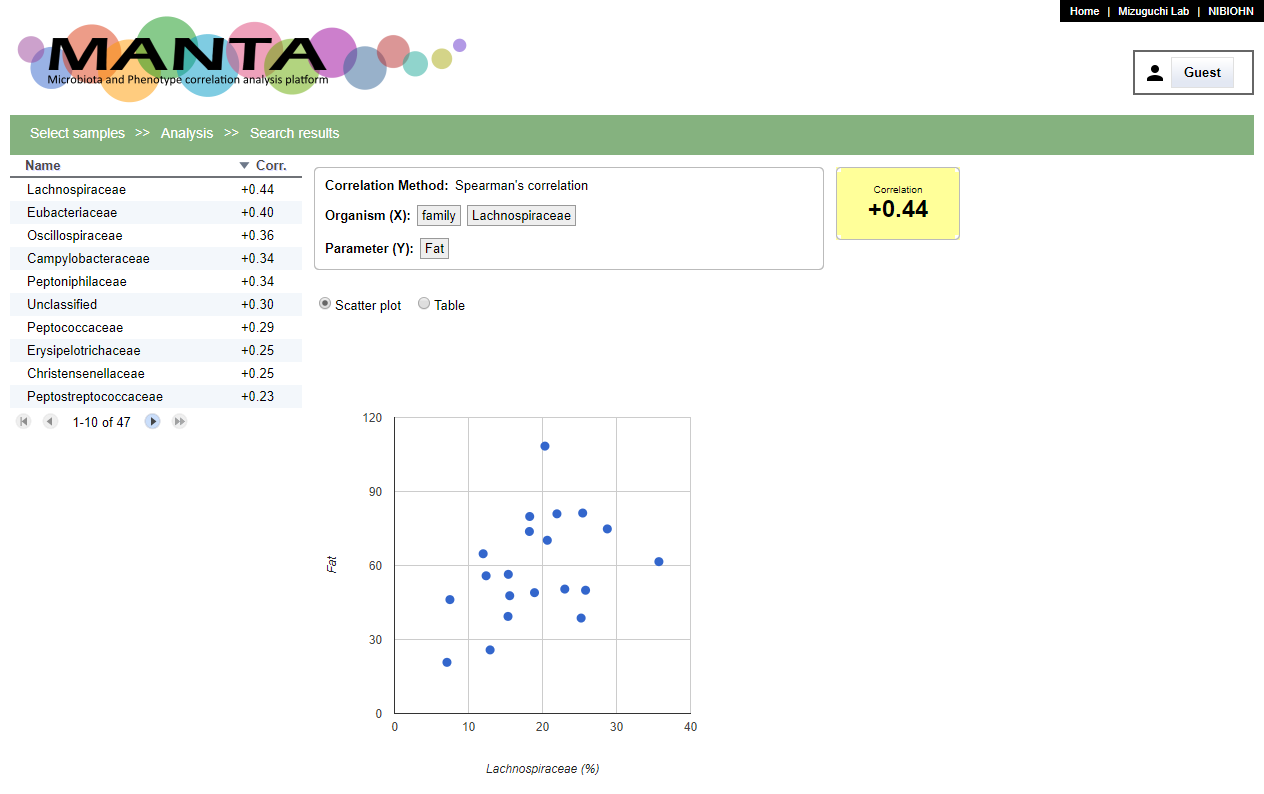
The search results will be shown in a table at left side with descending order by default. You can toogle the order by clicking on the header. There is a scatter polt at the middle of the window. Clicking on the taxon name will display the corresponding data in the plot.
Compare two parameters
The last tab is 'Compare two parameters' that allows you to compare any pair of taxa and parameters including parameter-to-parameter or taxon-to-taxon.